
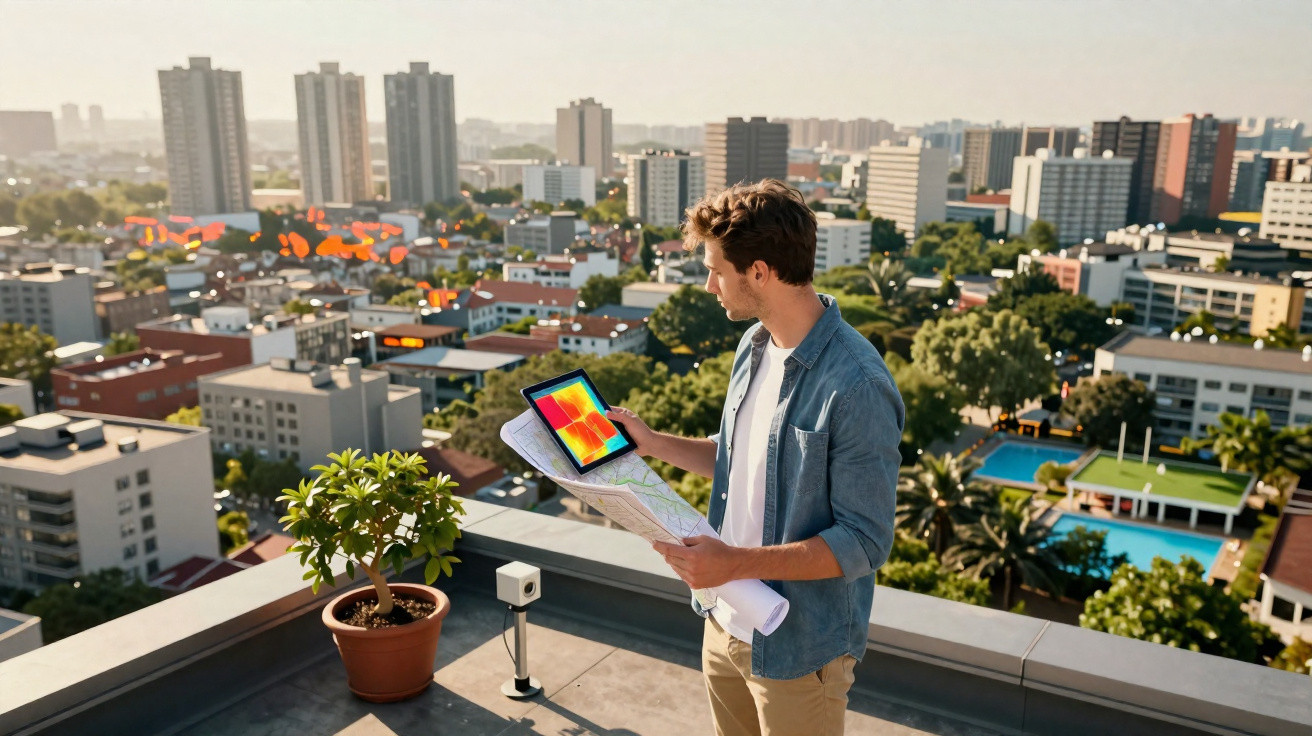
City dashboards tend to deal in averages: heat is reported as a single mean figure, planners tot up green space by counting total hectares, and economists judge prosperity by treating the entire metropolitan area as one unit.
Those headline numbers are not wrong, but they blur urban heat inequality and the uneven access to cooling, greenery and opportunity that often intensifies as a city spreads.
A fresh satellite-based assessment spanning more than 11,000 cities shows that these citywide averages conceal a consistent pattern - one governed by a precise mathematical relationship that had not previously been demonstrated at this global scale.
The bigger city trap in Huang’s satellite analysis
To examine how “big-city maths” plays out within city boundaries, Dr Conghong Huang of Nanjing Agricultural University (NAU) and collaborators assembled satellite datasets covering more than 11,000 cities around the world.
The team’s question was straightforward: as population rises, do a city’s hottest and greenest blocks start to resemble the rest of the city, or do they stand out more sharply?
The outcome was striking even to urban researchers. With each doubling of a city’s population, the divide between its most exposed neighbourhoods and its most protected ones increased by about 8 to 9 percent.
Crucially, this was not a one-off result tied to a single indicator - the same widening showed up across three different measures.
Reading the whole planet with satellite data
For every one of the 11,000+ urban centres, the researchers scored conditions neighbourhood by neighbourhood. They combined thermal imagery, night-time lights and vegetation mapping, drawing on publicly available satellite systems.
To compare places fairly across countries and climates, they used the Gini coefficient - the familiar 0-to-1 metric economists have relied on for around a century to quantify how unevenly something is shared.
Each city therefore received three Gini values: one describing the distribution of heat, one for green space, and one for economic activity. When the team plotted these against population size, the points aligned into a notably clean straight line.
A predictable pattern
That straight-line relationship is what physicists call a scaling law: the same rule links city size to inequality whether the settlement has 100,000 residents or is a 20 million-person megacity.
Smaller cities sit lower on this curve, while larger cities occupy higher positions - not randomly, but in a consistent, predictable way.
Earlier studies had already shown that outcomes such as wealth, patents and crime tend to increase faster than population, meaning large cities “overperform” on those measures.
What had not been demonstrated before this work was that inequality within cities follows an equally regular rule - and that it does so with the same precision across thousands of cities on every inhabited continent.
Urban heat inequality
Of the three results, the heat signal was the most pronounced. High temperatures clustered where there is extensive asphalt, limited tree cover and tightly packed low-rise roofs.
In larger cities, these hot pockets were increasingly separated from cooler, leafier blocks - a widening thermal divide visible from space.
The steepest separations appeared in arid cities. In hot, dry conditions, the absence of a single tree or the presence of an unshaded car park can lift a block by several degrees Fahrenheit (a few degrees Celsius) relative to the street next door.
Earlier US-focused research had pointed to this pattern in individual cities. This study shows the same relationship scaling up worldwide, following one shared curve.
Where the green ends
Green space provided the second strand of evidence. As cities expanded, parks, street trees and gardens did not distribute themselves evenly; instead, they became increasingly concentrated in wealthier neighbourhoods, while denser, poorer blocks tended to lose them first.
Ecologists describe this as the luxury effect - the tendency for richer areas to support more vegetation. As land becomes more valuable and development grows denser, green cover retreats to the places most able to retain it.
The clumping was most extreme in low-income countries. Doubling the population of a city in a poorer nation produced a larger jump in inequality than the same population doubling in a wealthier country.
Money pools tighter
Night-time light intensity - widely used as a proxy for economic activity - mirrored the same broad pattern.
As cities grew, their brightest zones became more concentrated: central offices, shopping centres and heavily trafficked commercial corridors stood out more strongly, while the edges were left comparatively dark.
Again, the sharpest concentration appeared in lower-income nations.
Across all three dimensions, the inequalities moved together. Neighbourhoods with fewer trees were more likely to be hotter and poorer, while adjacent better-off areas remained both greener and cooler. The result was a layered disadvantage that satellites can detect.
What planners face
In many countries, urban policy has rested on an optimistic premise: as cities become larger and wealthier, internal gaps should narrow naturally. The global data suggest the reverse - disparities widen, and they do so at a predictable, measurable rate.
That both removes a convenient excuse and provides a practical reference point. A planner in Lagos, Phoenix or Dhaka can compare their city to the global curve and see how local conditions stack up.
Public health teams can identify the hottest neighbourhoods and the thinnest tree cover ahead of the next heatwave. Likewise, investment in parks and planting can be directed to where the evidence indicates it will have the greatest impact, rather than where projects are simply easiest to deliver.
A new urban blueprint
The novelty here is the scale of the view. The 8% to 9% rule held across climates and continents, spanning the poorest countries through to the richest.
Inequality inside cities, the findings suggest, is not merely a quirk of poor governance in a handful of unfortunate places. It is tied to the mechanics of urban growth itself - unless intentional action interrupts the trend.
Huang and colleagues end with an uncompromising message: equitable cities do not emerge by chance. They must be designed and built deliberately, in opposition to the curve.






Comments
No comments yet. Be the first to comment!
Leave a Comment